
DataVista Diagnoses How Well Multimodal LLMs Understand Data Videos
DataVista evaluates 19 multimodal LLMs on 961 data videos, showing top models lag human experts in narrative reasoning.

Key Takeaways
- DataVista is the first systematic benchmark for evaluating how well multimodal LLMs understand data videos, using 961 real-world videos and 6,775 questions.
- It measures three progressive capabilities—data perception, temporal reasoning, and narrative understanding—across 10 question types and five topic domains.
- Among 19 tested models, Gemini-3.1-Pro leads with 70.0% accuracy but still trails human experts, with the biggest gaps in causal reasoning and narrative structure.
- Adding more frames or subtitles mainly improves lower-level perception and temporal reasoning, while narrative understanding remains structurally limited.
- The benchmark exposes common failure modes in chart reading, evidence judgment, and instruction following, offering a public baseline for future model improvement.
DataVista, a new benchmark from researchers behind the GitHub repository HKUSTDial, offers the first systematic evaluation of how well AI models understand data videos—the animated charts and narrated visualizations common in news and business analysis. The benchmark contains 961 real-world data videos and 6,775 evaluation questions, and its first round of testing suggests that even the best models have significant room to improve.
What makes data video understanding different
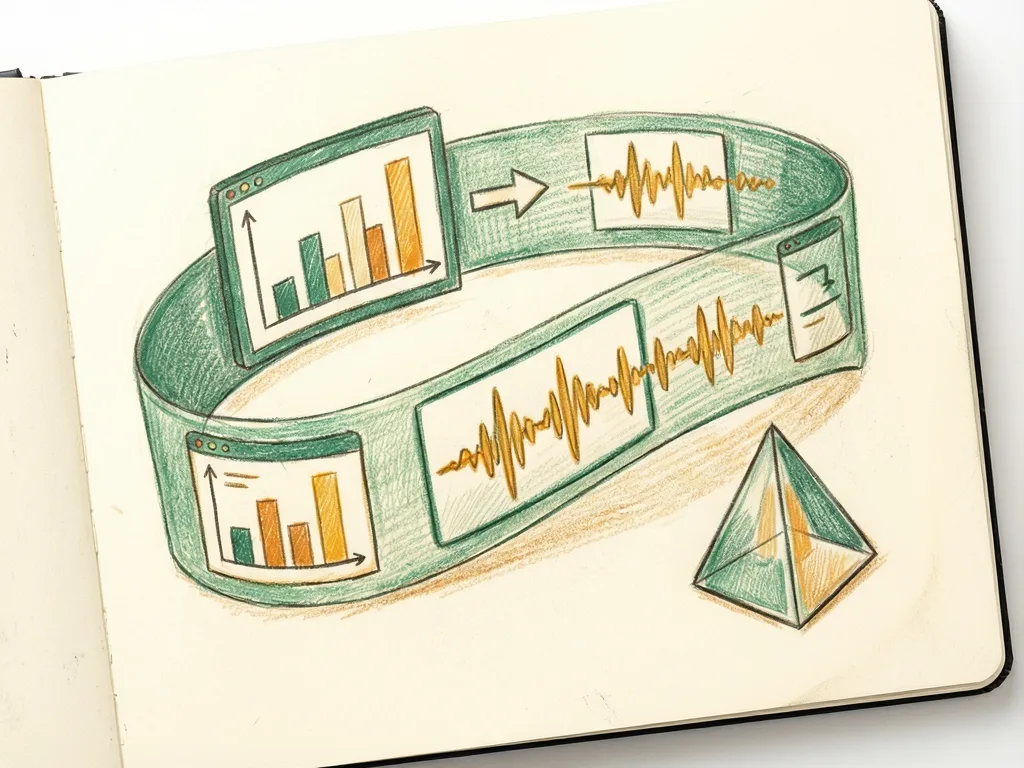
Data videos combine data visualization with video narrative. They are widely used in news reporting and business analysis. Unlike general video understanding, which focuses on recognizing objects and actions, data video understanding requires a model to accurately read data from animated charts, integrate evidence across both charts and time, and grasp how narrative organization and visual design communicate information.
That combination is harder than it sounds. A model must track a chart as it animates, connect what it sees at one moment to what happened earlier, and then interpret the overall story the video is telling. Existing benchmarks target either general videos or static charts. Data video understanding has not been systematically evaluated—until now.
A three-level framework with 10 question types
DataVista organizes its evaluation around a three-level progressive capability framework: data perception, temporal reasoning, and narrative understanding. Within that framework, the benchmark covers 10 fine-grained question types across five topic domains.
The design reflects the idea that understanding data videos is not a single skill but a stack of skills. A model first needs to perceive the data correctly. It then needs to reason about how that data changes over time. Finally, it needs to understand the narrative that ties the data together. Each level builds on the one below it, and failure at a lower level can undermine performance at a higher one.

Gemini-3.1-Pro leads, but trails human experts
The researchers systematically evaluated 19 mainstream MLLMs on DataVista. The best-performing model, Gemini-3.1-Pro, achieved 70.0% overall accuracy. While that is the top score among the models tested, it remains far below human expert performance.
The weakest areas were Causal Reasoning and Narrative Structure. These are the capabilities that sit at the top of the framework—exactly where understanding shifts from reading individual charts to interpreting the meaning of the whole video. The gap suggests that current models are better at extracting data than at explaining why it matters.
More frames and subtitles help only so much
The study also examined whether common interventions improve performance. Increasing frame counts and adding subtitles mainly benefited data perception and temporal reasoning. Gains in narrative understanding were limited.
That finding is notable because it suggests the bottleneck is not simply a matter of giving models more visual information or more text. Even with more frames and subtitles, models struggle to assemble evidence into a coherent narrative. The limitations appear to be structural rather than a matter of input volume.
Typical failure modes
Further analysis of model responses identified typical failure modes in chart reading, evidence judgment, and instruction understanding. In other words, models make mistakes at multiple stages: they misread what a chart shows, they misjudge which evidence is relevant, and they misunderstand what the question is asking.

These failure modes matter for anyone building or using AI systems that work with data videos. A model that misreads a chart will produce unreliable answers no matter how strong its reasoning is elsewhere. A model that misjudges evidence may cite the wrong part of a video. A model that misunderstands instructions may answer a different question than the one asked.
What this means for readers
For journalists, analysts, and product teams who work with data videos, DataVista provides a way to measure whether AI tools can actually handle this media form. The benchmark is publicly available at https://github.com/HKUSTDial/DataVista, which means researchers and developers can test their own models against the same questions and compare results.
The headline result—70.0% overall accuracy for the best model, far below human experts—sets a clear baseline. It also highlights where progress is needed most: causal reasoning and narrative structure. Until models improve at those levels, AI systems will remain better at reading data videos than at understanding them.
What to watch next
The benchmark's release opens several lines of follow-up work. Researchers can use it to diagnose specific weaknesses, test whether new training methods improve narrative understanding, or explore why more frames and subtitles yield limited gains at the highest level. For now, DataVista offers a concrete, reproducible way to track progress on a problem that has been easy to describe but hard to measure.


Comments (0)