
Comparing Graph-RAG and Standard RAG: A Hallucination Benchmark for Fact-Dense Queries
Compare deterministic 3-tier Graph-RAG and vector RAG on fact-dense queries using repeatable benchmarks, metrics, and blind scoring rubrics.
Key Takeaways
- The article proposes a repeatable benchmark method for comparing a deterministic 3-tier Graph-RAG system with a standard vector RAG pipeline on fact-dense queries.
- Fact-dense questions require multiple connected facts, such as entities, relationships, dates, and numbers, where standard vector retrieval can miss evidence split across documents.
- A fair comparison should use the same corpus, questions, generation model, and locked settings while recording retrieval paths, graph snapshots, seeds, and caching behavior.
- Evaluation should measure fact coverage, answer correctness, citation validity, refusal behavior, determinism, and failure modes to judge whether Graph-RAG’s added complexity is worthwhile.
Meta description: Learn how to benchmark a deterministic 3-Tiered Graph-RAG system against a standard vector RAG pipeline on fact-dense queries with repeatable evaluation steps.
Tags: GraphRAG, RAGEvaluation, VectorRAG, AIEngineering

This guide is for AI engineers, product managers, and evaluation leads who need a repeatable way to compare a deterministic 3-Tiered Graph-RAG system against a standard vector RAG pipeline on fact-dense queries. RAG means retrieval-augmented generation, where an AI system retrieves context before producing an answer. The source material does not provide dates, model names, costs, scores, or details about the three tiers, so this article gives an evaluation method rather than a published result.
Why this comparison matters
Fact-dense queries are questions that depend on many specific pieces of information, such as entities, relationships, dates, numeric values, or conditions. A standard vector RAG pipeline usually retrieves text chunks by embedding similarity. That can work well when the answer is contained in one nearby paragraph. It can also fail when the answer needs several connected facts that are split across documents.
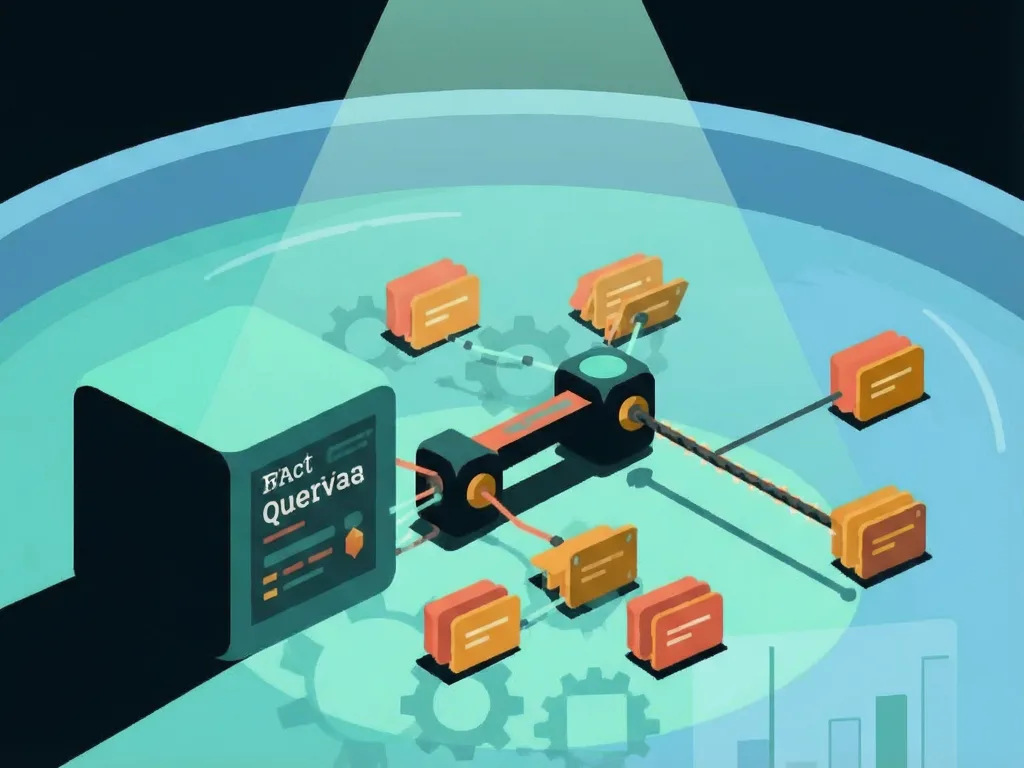
A Graph-RAG system uses graph relationships to connect entities and facts. A deterministic 3-Tiered Graph-RAG system adds two important conditions: the retrieval path should be reproducible under fixed settings, and the system is organized in a three-level structure. If the exact contents of the three tiers are not documented, do not assume a specific architecture. Keep the configuration fixed and evaluate what the system actually does.
This comparison matters because graph systems can require more maintenance, while vector systems can be simpler. A benchmark helps a team decide whether the added structure improves answer quality on the queries that matter to the product.
Step-by-step benchmark design
- Build a fact-dense query set. Create questions that require multiple facts, not only broad summaries. Include entity names, relationships, dates, numbers, and constraints when they are part of the real workload. Separate the questions used for development from those used for final scoring so the system is not tuned only on test items.
- Define the two comparison units. Use the same question set, corpus, answer length limit, and generation model for both a deterministic 3-Tiered Graph-RAG system and a standard vector RAG pipeline. If the generation model changes between systems, the comparison will measure model behavior instead of retrieval architecture.
- Lock the deterministic settings. For each run, record the model version, temperature, seed if supported, retrieval count, chunk size, graph snapshot, and any caching behavior. Determinism means the same input should produce the same output when the settings are unchanged. External APIs, random ranking, floating-point operations, and cache states can still break reproducibility, so log them.
- Choose metrics that match the task. For retrieval, track whether the needed facts appear in the retrieved context. For generation, track answer correctness, citation validity, and whether the system says it cannot answer when evidence is missing. For operations, track latency and cost only if your team has real data. Do not invent thresholds.
- Create a scoring rubric. For each query, list the required facts and required relationships. Use programmatic checks for exact entities, dates, and numbers where possible. Use human review for answer quality, citation accuracy, and whether a response misleads the user. Keep reviewers blind to which system produced the answer when possible.
- Run both systems in the same way. For each query, store the question, the retrieved chunks or graph nodes, the generated answer, the settings used, and any error messages. Repeat runs only if settings are not fully locked. If the systems are deterministic and inputs are fixed, one clean run may be enough for the retrieval path, but validation runs are still useful for operational stability.
- Classify errors before choosing a winner. A failure may come from missing source documents, poor chunking, incorrect graph edges, bad ranking, missing citations, or an unfaithful answer. This step prevents a team from blaming the RAG architecture when the real problem is data quality.
How to read the results
The goal is not to prove that graph retrieval is always better. The goal is to see where the deterministic 3-Tiered Graph-RAG system changes the evidence that reaches the model. A standard vector RAG pipeline may answer single-fact questions well. A graph-oriented system may help when the answer depends on connected facts, but only if the graph is accurate and the retrieval path is reliable.
Use a table to organize observations without adding invented scores.

| Evaluation dimension | What to check in a standard vector RAG pipeline | What to check in a deterministic 3-Tiered Graph-RAG system |
|---|---|---|
| Evidence retrieval | Whether similar chunks contain the needed facts | Whether the configured tier path connects entities, relations, and facts |
| Fact coverage | Whether required entities, dates, and numbers appear in retrieved context | Whether multi-hop facts are represented without missing nodes or edges |
| Determinism | Whether the same query returns the same chunks and answer under fixed settings | Whether the same query follows the same tier path and answer under fixed settings |
| Failure mode | Whether it retrieves plausible but incomplete text | Whether graph construction or traversal misses a relationship |
If the graph system answers more fact-dense queries correctly, the next question is whether the improvement is worth the extra engineering burden. If it does not, the benchmark shows that a simpler vector pipeline may be enough for the current workload.
What this means for teams
For product teams, this benchmark is a decision tool. Fact-dense queries often appear in internal knowledge bases, compliance reviews, technical support, research assistants, and enterprise documentation. These tasks need precise evidence, not only fluent text.
For engineering teams, the comparison clarifies whether the bottleneck is retrieval, generation, or data structure. If both systems retrieve the right facts but the answer is still wrong, changing the RAG architecture may not help. If the graph system retrieves more connected evidence, the next step is to test whether that evidence reduces hallucinations and improves citation quality.
For non-experts, the practical takeaway is simple: a graph-based system can be useful when answers depend on relationships, but its value should be measured with the same questions and settings that real users will face.
Common mistakes
- Using only easy, single-fact questions. This hides the strengths and weaknesses of both systems.
- Changing the corpus, model, or answer length between systems. This makes the comparison unreliable.
- Treating citations as proof of accuracy. A citation can be real but still point to the wrong fact.
- Ignoring maintenance. A graph system needs correct nodes, edges, updates, and quality checks.
- Forgetting that determinism can break. Cache states, external services, and unsupported random seeds can change results.
- Assuming the three tiers have a specific meaning. If the source material does not define them, keep them fixed and test observed behavior.
- Publishing a score that was never measured. The source material does not provide benchmark numbers, so teams should report only results from their own controlled runs.




Comments (0)